Auto insurance claims costs rebounded this year after plummeting during the COVID-19 pandemic, but the number of collision claims remain 15% below 2019 levels, according to a report by CCC Intelligent Solutions.
While highway traffic levels — and hence auto claims — have returned to more normal levels, the severity of accidents has not. The report by CCC industry analyst Susanna Gotsch says a trend toward more severe accidents that started during the height of the pandemic shutdowns has continued as restrictions eased. Because of supply chain disruptions, replacement parts are more expensive and harder to find.
“Demand for parts has rebounded faster than many of the parts manufacturers and distributors expected, leading to an increase of ‘out of stock’ from aftermarket or ‘backorder’ scenarios for OEM parts,” the report says. “Even when parts are available, they may be stuck overseas where the issue is getting the parts from the warehouse to the ports, onto the ship, and then unloaded and delivered here in the U.S.”
The CCC report says traffic patterns changed during the pandemic, which changed the mixture of claim types. According to numerous sources, about 40% of U.S. workers continued to work remotely as of Oct. 1. Numerous companies have indicated they will postpone the return of employees to the office until early 2022, the report said.
That doesn’t mean drivers are staying off the road. According to the US Department of Transportation data, the total miles driven in the first quarter of 2021 was 7.4% below the same period of 2019. In the second quarter of 2021, it was 4.1% less.
While roads are slightly more crowded, they are more deadly than before. The number of traffic fatalities per 100 million miles driven ranged from about 1 to 1.2 for all of the past decade, but leaped up to 1.5 in the third quarter of 2020 before dropping slightly below 1.3 in the first quarter of 2021, according to National Highway Traffic Safety Administration data.
CCC data shows that the percentage of collision claims where the vehicle was rendered non-drivable was greater in every month of 2021 compared the same month in 2020 and 2019. The increase was even more stark for liability claims, where the percentage of non-drivable accidents was nearly 25% in most months of 2021, compared to about 20 to 21% in 2019.
The increased number of non-drivable accidents corresponded with more severe bodily injury claims, the report says. CCC’s analysis of procedure data showed an increase in observed head injury, soft tissue nerve and disc injury as the primary diagnoses, and increases in the percentage of claims with surgical procedures compared to pre-pandemic averages.
Vehicle repairs are also costing more. CCC shows that the average total loss claim cost climbed from slightly less than $8,000 in 2010 to slightly less than $10,000 in 2020, then jumped to more than $12,000 in 2021.
CCC said attributed the steady increase in vehicle replacement cost to thegrowing complexity of automobiles during that period.
“The rate of increase in both repair costs and total loss costs over the four quarters ending Q2 2021 however are some, if not the most significant increases we’ve seen, and are predominantly being driven by global supply chain disruptions and shortage of workers in many fields,” the report says.
The report said the average cost for parts increased 6% in 2021 from 2020, the largest increase since 1997.
“At the same time growing complexity has led to an increase in the average number of replacement parts per appraisal/repair, a trend heightened by an increase in non-driveable claims,” the report says.
Vehicles are also taking longer to repair. The report says the average backlog for repair shops was 2.6 weeks during the third quarter of 2021, a full week longer than the prior quarter. The average backlog was 1.7 weeks during the third quarter of 2019.
A report by data analytics company Arity, which says it has the largest telemetry dataset tied to insurance claims, sheds more light on changing driving habits. Arity reported that its data, taken from input from 27 million vehicles, shows that the total miles driven in July 2021 was up 8% more than July 2019, after dropping by 50% during the height of government lockdowns in April 2020.
That traffic is moving faster. One out of every 20 miles was driven at speeds over 80 mph this year, compared to one out of every 25 miles in 2019, the Arity report says.
Drivers also have also abandoned their old routines. Weekday nighttime driving this summer increased 56% over 2019 summer averages. The number of miles driven at over 80 mph at night increased 42% since 2019.
“Crashes that happen at higher speeds tend to be more catastrophic,” the report says.
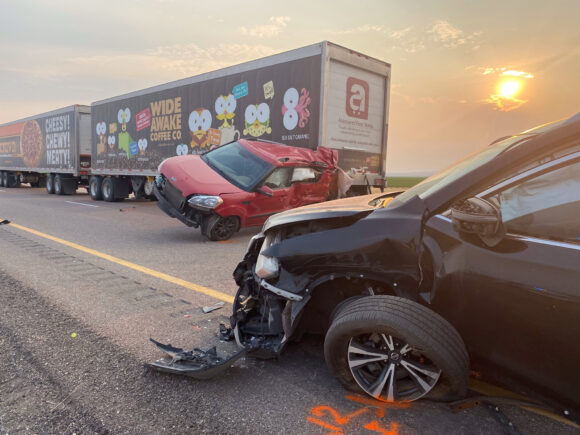
About the photo: This photo provided by the Utah Highway Patrol and posted on the Utah Department of Public Safety website shows several of the vehicles involved in a fatal pileup, Sunday, July 25, 2021, on Interstate 15 in Millard County, near the town of Kanosh, Utah. (Utah Highway Patrol via AP)
Was this article valuable?
Here are more articles you may enjoy.
 Scientists Affirm Climate Change Fuels Extreme Weather
  Software Firm CCC Intelligent Solutions Exploring Sale: Reuters
  Former Pro Soccer Players Show Brain Changes But No Cognitive Decline
  US P/C Industry Books Best Result in a Decade but Not All Lines Enjoy Success
Want to stay up to date?
Get the latest insurance news
sent straight to your inbox.