More than 6.9 million homes along the Atlantic and Gulf Coasts are at potential risk of damage from hurricane storm surge inundation with a total reconstruction cost value (RCV) of more than $1.6 trillion (Table 1), according to CoreLogic, a global property information, analytics and data-enabled solutions provider.

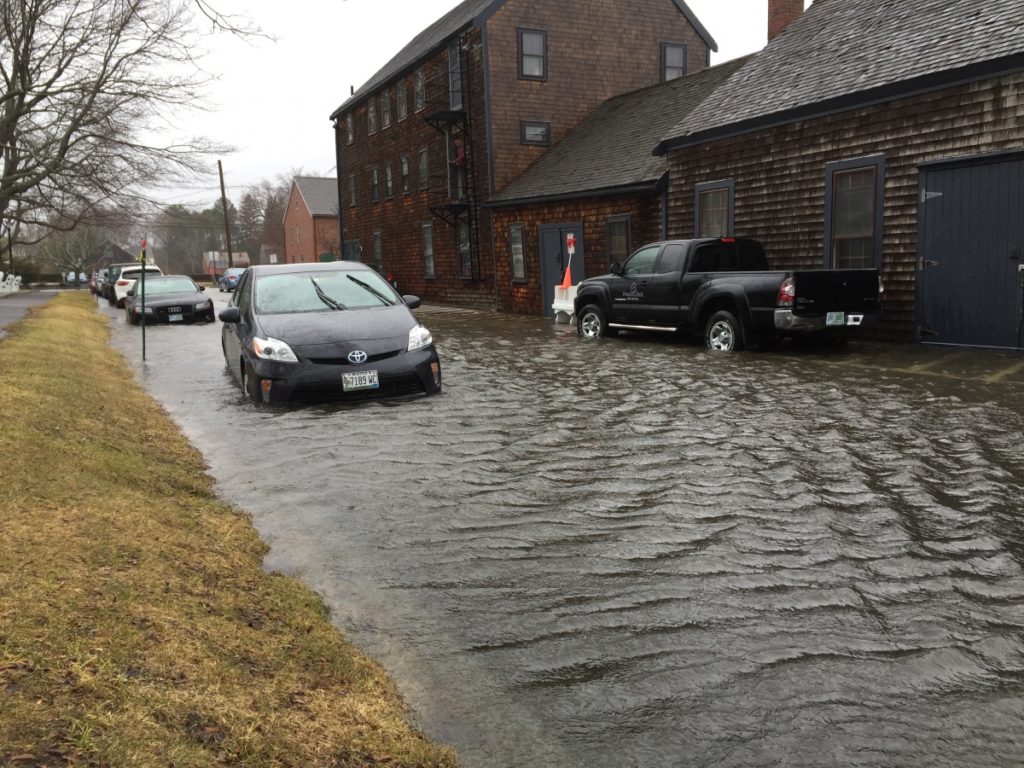
Photo credit: Melissa Paly
The 2018 CoreLogic Storm Surge Report analysis examines risk from hurricane-driven storm surge for homes along the Atlantic and Gulf coastlines across 19 states, as well as for 86 metro areas. Homes are categorized by five risk levels: Low (homes affected only by a Category 5 storm), Moderate (homes affected by Category 4 and 5 storms), High (homes affected by Category 3, 4 and 5 storms), Very High (homes affected by Category 2, 3, 4 and 5 storms) and Extreme (homes affected by Category 1-5 storms). RCV figures represent the cost to completely rebuild a property in case of damage – including labor and materials by geographic location – assuming the worst-case scenario at 100-percent destruction.
“While industry predictions for this year’s storm season indicate average activity levels, associated storm surge risk remains an important consideration for residential and commercial properties in the 19 states analyzed,” said Dr. Tom Jeffery, senior hazard scientist at CoreLogic. “Depending on the location of a storm’s landfall and that area’s population density and reconstruction costs, lower Category storms can cause just as much damage as storms in higher categories.”
Regionally, the Atlantic Coast has more than 3.9 million homes at risk of storm surge with an RCV of more than $1 trillion (Table 2), an increase of around $30 billion compared to 2017. The Gulf Coast has more than 3 million homes at risk with over $609 billion in potential exposure to total destruction damage, with over $16 billion increase compared to 2017. Areas with less coastal exposure but with lower elevations that extend inland tend to have more total homes at risk because the surge water can travel farther inland. Additionally, due to market conditions and previous storm surge damage, construction costs can increase despite having a lower number of at-risk homes compared to other states or Core-Based Statistical Areas (CBSAs).
At the state level, Florida has the most coastal exposure and has the most susceptibility to storm surge flooding of the 19 states analyzed, with more than 2.7 million at-risk homes across the five risk categories (Table 3). Louisiana ranks second with over 817,000 at-risk homes, Texas ranks third with more than 543,000 at-risk homes, and New Jersey ranks fourth with over 471,000 at-risk homes. Since the number of homes at risk strongly correlates with the accompanying RCV, Florida also has the highest RCV at over $552 billion (Table 4). Notably, New York ranks second in RCV with over $190 billion, despite its fifth-place ranking in number of homes at risk, due to the density of the residential population near the coast and higher construction costs in this state. Louisiana and New Jersey are also near the top of the list for RCV, with Louisiana totaling more than $186 billion and New Jersey totaling over $146 billion. Texas sits in fifth place for RCV, at more than $103 billion.
Due to the concentration of residences in and around large metro areas, 15 CBSAs account for 67.2 percent of the 6.9 million total at-risk homes and 68.2 percent of the total $1.6 trillion RCV (Table 5). This reinforces the idea that the location of future storms will be integral to understanding the potential for catastrophic damage. A low-intensity storm in a densely populated, residential urban area can do significantly more damage than a higher-intensity hurricane along a sparsely inhabited coastline. The Miami metro area, which includes Fort Lauderdale and West Palm Beach, has the most homes at risk, totaling over 788,000 with an RCV of more than $156 billion. By comparison, the New York metro area has slightly fewer homes at risk at just over 726,000, but a significantly higher RCV totaling more than $277 billion, a 5 percent increase compared to 2017.
Note: The numbers in Tables 1-4 are cumulative, increasing in value from extreme to low. This is based on the explanation that Category 5 storms are low risk because they are least likely to occur, but will cause more storm surge flooding inland than higher-risk, lower Category storms.
Table 1 – Total Number of Homes at Risk Nationally and Estimated Reconstruction Cost Value
|
Storm Surge Risk Level (Storm Category) |
Total Homes Potentially Affected |
Total Estimated RCV (U.S. Dollars) |
|
Extreme (Category 1-5 storm) |
806,735 |
$191,170,832,774 |
|
Very High (Category 2-5 storm) |
2,509,236 |
$608,263,801,243 |
|
High (Category 3-5 storm) |
4,557,089 |
$1,088,338,913,877 |
|
Moderate (Category 4-5 storm) |
6,050,936 |
$1,442,435,751,572 |
|
Low (Category 5 storm) |
6,942,499 |
$1,620,652,870,673 |
Source: CoreLogic 2018
Table 2 – Residential Property Exposure by Coastal Region
|
Regional Risk |
Atlantic Coast Homes |
Atlantic Coast RCV (U.S. Dollars) |
Gulf Coast Homes |
Gulf Coast RCV (U.S. Dollars) |
|
Extreme |
456,688 |
$122,684,450,321 |
350,047 |
$68,486,382,453 |
|
Very High |
1,438,100 |
$398,084,569,726 |
1,071,136 |
$210,179,231,517 |
|
High |
2,506,545 |
$672,405,046,607 |
2,050,544 |
$415,933,867,270 |
|
Moderate |
3,460,837 |
$916,771,265,997 |
2,590,099 |
$525,664,485,575 |
|
Low |
3,924,023 |
$1,011,558,178,641 |
3,018,476 |
$609,094,692,032 |
Source: CoreLogic 2018
Table 3 – At Risk Home Totals by State
|
Rank |
State |
Extreme |
Very High |
High |
Moderate |
Low* |
|
1 |
Florida |
351,093 |
1,064,674 |
1,752,603 |
2,292,791 |
2,774,175 |
|
2 |
Louisiana |
72,256 |
207,442 |
624,521 |
747,111 |
817,480 |
|
3 |
Texas |
39,109 |
117,558 |
253,947 |
384,944 |
543,847 |
|
4 |
New Jersey |
95,659 |
278,539 |
382,065 |
471,353 |
N/A |
|
5 |
New York |
75,238 |
224,558 |
347,236 |
462,380 |
N/A |
|
6 |
Virginia |
26,960 |
94,378 |
246,824 |
366,478 |
409,129 |
|
7 |
South Carolina |
35,934 |
126,997 |
209,026 |
294,239 |
347,030 |
|
8 |
North Carolina |
32,282 |
95,286 |
160,831 |
210,233 |
259,718 |
|
9 |
Massachusetts |
11,048 |
46,558 |
102,189 |
157,898 |
N/A |
|
10 |
Georgia |
8,887 |
50,409 |
105,735 |
141,518 |
152,559 |
|
11 |
Maryland |
17,824 |
60,553 |
99,056 |
125,417 |
N/A |
|
12 |
Mississippi |
9,261 |
30,353 |
60,620 |
90,010 |
101,720 |
|
13 |
Pennsylvania |
932 |
20,815 |
56,830 |
83,808 |
N/A |
|
14 |
Connecticut |
7,167 |
28,497 |
46,618 |
67,207 |
N/A |
|
15 |
Alabama |
6,379 |
17,306 |
32,331 |
44,744 |
57,973 |
|
16 |
Delaware |
8,901 |
24,649 |
40,048 |
56,418 |
N/A |
|
17 |
Rhode Island |
1,876 |
8,153 |
17,312 |
26,484 |
N/A |
|
18 |
Maine |
5,645 |
7,960 |
11,851 |
18,150 |
N/A |
|
19 |
New Hampshire |
284 |
4,551 |
7,446 |
9,753 |
N/A |
Source: CoreLogic 2018
*The low risk category refers to Category 5 hurricanes, which are not common along the northeastern Atlantic Coast. States in that region are designated as N/A for this category due to the extremely low probability of a Category 5 storm affecting these areas.
Table 4 – Reconstruction Cost Value of At Risk Homes by State
|
Rank |
State |
Extreme |
Very High |
High |
Moderate |
Low* |
|
1 |
Florida |
$68,993,319,371 |
$214,615,495,959 |
$353,434,047,211 |
$458,546,265,943 |
$552,417,823,248 |
|
2 |
New York |
$29,069,437,198 |
$92,192,934,548 |
$142,653,686,948 |
$190,523,945,573 |
N/A |
|
3 |
Louisiana |
$15,058,006,592 |
$44,361,573,373 |
$141,431,122,080 |
$169,398,148,734 |
$186,089,070,917 |
|
4 |
New Jersey |
$27,210,934,630 |
$83,140,546,592 |
$116,378,523,825 |
$146,074,429,226 |
N/A |
|
5 |
Texas |
$6,544,802,706 |
$20,281,149,088 |
$46,590,193,249 |
$73,689,714,628 |
$103,257,560,067 |
|
6 |
Virginia |
$6,889,209,422 |
$23,532,519,915 |
$57,147,551,590 |
$84,231,366,445 |
$95,057,016,309 |
|
7 |
South Carolina |
$10,365,743,962 |
$33,689,536,077 |
$52,352,428,765 |
$70,363,340,488 |
$80,775,388,252 |
|
8 |
North Carolina |
$6,502,998,590 |
$19,557,292,731 |
$33,348,232,464 |
$43,887,698,767 |
$54,356,018,315 |
|
9 |
Massachusetts |
$2,980,187,240 |
$13,363,727,998 |
$29,309,257,327 |
$46,442,774,460 |
N/A |
|
10 |
Georgia |
$2,740,063,841 |
$13,213,068,236 |
$24,703,010,004 |
$31,744,968,374 |
$33,763,709,156 |
|
11 |
Maryland |
$4,349,256,919 |
$14,483,853,619 |
$23,474,382,707 |
$29,806,926,424 |
N/A |
|
12 |
Connecticut |
$2,559,481,204 |
$9,608,686,921 |
$15,452,737,215 |
$22,111,853,493 |
N/A |
|
13 |
Mississippi |
$1,977,375,919 |
$6,157,332,097 |
$11,913,778,331 |
$17,373,187,675 |
$19,557,738,154 |
|
14 |
Pennsylvania |
$216,076,484 |
$4,664,438,284 |
$13,120,822,659 |
$19,444,951,459 |
N/A |
|
15 |
Delaware |
$2,635,651,997 |
$7,021,080,076 |
$11,463,739,373 |
$16,078,182,995 |
N/A |
|
16 |
Alabama |
$1,203,825,492 |
$3,124,223,041 |
$5,789,839,450 |
$7,962,250,197 |
$10,139,735,934 |
|
17 |
Rhode Island |
$528,745,488 |
$2,408,462,659 |
$5,093,849,517 |
$7,809,201,093 |
N/A |
|
18 |
Maine |
$1,281,230,692 |
$1,914,444,383 |
$2,960,376,784 |
$4,634,377,599 |
N/A |
|
19 |
New Hampshire |
$64,485,027 |
$933,435,646 |
$1,721,334,378 |
$2,312,167,999 |
N/A |
Source: CoreLogic 2018
*The low risk category refers to Category 5 hurricanes, which are not common along the northeastern Atlantic Coast. States in that region are designated as N/A for this category due to the extremely low probability of a Category 5 storm affecting these areas.
Table 5 – Top 15 Metropolitan Areas for Storm Surge Risk
|
Rank |
Metropolitan Area |
Total Homes at Risk of Storm Surge |
Total Estimated RCV (U.S. Dollars) |
|
1 |
Miami, FL |
788,679 |
$156,109,638,962 |
|
2 |
New York, NY |
726,048 |
$277,316,495,768 |
|
3 |
Tampa, FL |
459,082 |
$79,154,913,706 |
|
4 |
New Orleans, LA |
395,975 |
$95,278,109,445 |
|
5 |
Virginia Beach, VA |
389,938 |
$90,904,781,082 |
|
6 |
Fort Myers, FL |
318,950 |
$63,465,095,946 |
|
7 |
Houston, TX |
284,622 |
$57,652,653,916 |
|
8 |
Bradenton, FL |
254,535 |
$49,231,359,219 |
|
9 |
Naples, FL |
186,100 |
$39,684,021,652 |
|
10 |
Jacksonville, FL |
171,332 |
$38,495,385,153 |
|
11 |
Philadelphia, PA |
165,300 |
$41,317,614,113 |
|
12 |
Charleston, SC |
149,900 |
$37,938,251,071 |
|
13 |
Myrtle Beach, SC |
128,155 |
$22,792,717,625 |
|
14 |
Boston, MA |
126,263 |
$34,937,253,340 |
|
15 |
Beaumont, TX |
121,379 |
$21,026,736,810 |
|
Total |
4,666,258 |
1,105,305,027,808 |
Source: CoreLogic 2018
Methodology
The analysis in the 2018 CoreLogic Storm Surge Report encompasses single-family residential structures less than four stories, including mobile homes, duplexes, manufactured homes and cabins (among other non-traditional home types). This is not an indication that there will be no damage to residential units greater than four stories, as there may be associated wind or debris damage. However, including all high-rise residential units in the analysis would inaccurately skew the actual number of houses at risk, as elevated structures are not as susceptible to damage from surge waters.
Year-over-year changes between the number of homes at risk and the RCV can be the result of several variables, including new home construction, improved public records, enhanced modeling techniques, fluctuation in labor, equipment and material costs – even a potential rise in sea level. For that reason, direct year-over-year comparisons should be warily considered. To estimate the value of property exposure of single-family residences, CoreLogic uses its RCV methodology which estimates the cost to rebuild the home in the event of a total loss and is not to be confused with property market values or new construction cost estimation. Reconstruction cost estimates more accurately reflect the actual cost of damage or destruction of residential buildings that would occur from hurricane-driven storm surge, since they include the cost of materials, equipment and labor needed to rebuild. These estimates also factor in geographical pricing differences (although actual land values are not included in the estimates). The values in this report are based on 100 percent (or “total”), destruction of the residential structure. Depending on the amount of surge water from a given storm, there may be less than 100 percent damage to the residence, which would result in a lower realized RCV.
To evaluate storm surge risk at the local level, CoreLogic uses the designation of Core-Based Statistical Areas (CBSAs), which are often referred to as metropolitan areas (>50,000 people), or micropolitan areas (<50,000 people), as defined by the U.S. Office of Management and Budget. The CBSA represents an urban center and the adjacent regions that are tied to that center socioeconomically. The specific areas identified in this report are named by primary urban center, though each may contain additional urban areas.
Source: CoreLogic
Was this article valuable?
Here are more articles you may enjoy.
 Ex-Banker Convicted in Deadly Car Crash Seeks Ferrari Records
  Insurers Avoid $664 Million Hit From Nord Stream Pipeline Blasts
  Allianz Unit to Cut as Many as 1,800 Jobs in Push to Adopt AI
  Xi Voices Worry on Work Safety After Shoe Factory Fire Kills 28
Want to stay up to date?
Get the latest insurance news
sent straight to your inbox.