
The El Nino raising temperatures across the Pacific and roiling global weather patterns is poised to make the record books, but anyone who tells you which position it will take could be much mistaken.
The best tool for measuring the strength of the phenomenon will probably end up being a rear-view mirror.
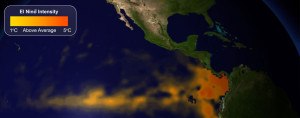
The current El Nino now is in the top three such events, according to the latest average temperatures from July to September, surpassed in the same time period only by readings from 1987 and the record year of 1997, according to the U.S. Climate Prediction Center in College Park, Maryland.
“There is some argument that it could be in the top two, depending on how you slice and dice the data,” said Michelle L’Heureux, a meteorologist at the center. “It is an impressive event.”
The trouble is, the measurements from July to September aren’t going to be where the El Nino ends up. Chances are the peak won’t come until the October to December period or November to January.
Or as Emily Becker, a researcher at the center, joked in a blog post, the peak will coincide with the height of pumpkin- spice latte season.
So why is this important? Because the uphill climb that temperatures have been making doesn’t guarantee the height they will eventually reach.
Take the 1987-88 El Nino, for instance. If you looked at its July to September temperatures, it would appear to take the spot for second on records dating back to 1950.
Where’s Peak?
The 1987-88 El Nino was actually topped by five other events because the 1.6 degrees that looked so impressive turned out to be its peak. The 1982-83 El Nino that was only 1 degree above normal in July to September started to hit its stride in October and pushed its way to the No. 2 spot with a peak of 2.1 degrees.
“We’re ahead of ’82-’83, but it doesn’t mean that we are going to stay ahead of it,” L’Heureux said. “They all move at their own pace.”
There are some troubling signs for anyone betting on the ultimate strength of the current El Nino.
In strong El Ninos, surface winds that blow east to west decline, allowing warm water to gather in the equatorial Pacific, Becker wrote in the blog post. In 1997-98 the winds actually reversed direction and started blowing from west to east.
This year, those winds have “lagged a bit behind the stronger El Ninos so far,” Becker wrote. And since the start of October, they have actually gained a little strength. Whether they will be last long enough to push the warm water out of the central Pacific remains to be seen.
Rankings Watched
This may not be what traders in the energy and commodity markets want to hear. After all, their livelihood depends on being able to figure out what’s going to be happening six months from now, not what happened six months ago.
“I do understand the fascination with rankings,” L’Heureux said. “El Ninos are one of those things that should not be ranked.”
At least not right now. Instead, a careful reading of wind speeds, temperature anomalies and air-pressure gradients across the Pacific will be the only real clues to what will happen.
And for those looking for a final ranking, well, come back in February when the “pumpkin-spice latte” figures come in, and we’ll see where this El Nino stacks up compared with previous years.
Was this article valuable?
Here are more articles you may enjoy.
 US Takes Aim at Autonomous Car Mishaps in Safety Rulemaking Push
  PG&E Says Power Shutoffs Required in California on Wildfire Risk
  New York, California Sizzle as Extreme Heat Strains Power Grids
  CSU Lowers Atlantic Hurricane Forecast to ‘Well Below Normal’
Want to stay up to date?
Get the latest insurance news
sent straight to your inbox.