A new form of predictive analytics offers the ability to detect fraud committed by a group or ring in real time.
According to Philip Rathle, vice president of products for California-based Neo4j, graph analysis dates back to 2000, when the company’s CEO and co-founder, Emil Eifrem, created a property graph model.
“The idea was, instead of trying to fit all data into these pre defined tables with pre defined attributes and then using relational technology to navigate those, store the data how it looks, the way you would draw it on a whiteboard where you have circles that represent things or nouns, and then lines with arrows pointing at other circles which are groups, and describe relationships between things,” explained Rathle. “That eventually evolved into Neo4j, and evolved into a generalized data model query language … that’s since been adopted by other companies aside from ourselves.”
Rathle says this emerging area of predictive analytics takes a couple of different forms, but generally it involves trying to understand behavior before it occurs.
According to Rathle, there are two ways of predicting behavior.
“One way is to try to understand all the facts about individual people or things and then make a prediction based on that. That will give you a certain degree of accuracy if you know my age, my height, my weight, and maybe if we are looking say at health insurance you’ve got all information about my blood work and that kind of thing. That enables a certain quality decision to be made,” explained Rathle. “The other is if I start bringing in relationships between myself and the people that I interact with in places that I interact in, then you can start to make much more accurate predictions. If you know who my spouse is, who my friends are.”
He explained that researcher James Fouler, studying obesity and alcoholism, found that there is a much better chance of predicting whether someone will be obese or an alcoholic based on their social relationships rather than their personal health information.
Rathle co-wrote a white paper with Gorka Sadowski, an IT security expert who has worked in fraud prevention across a number of different industries, on using graph analysis for fraud detection.
“If you look at fraud patterns, you can divide them into two, where you have lone individuals out there who might have stolen a credit card out of a wallet and are trying to get by with a more minor individual instance of theft,” said Rathle.
He explained that the techniques used to detect the individual fraudster are proven and established.
“They’re constant and companies have systems in place which will look…at someone’s common transaction patterns, and if all of a sudden you have a set of charges coming from a particular card that within a few hours results in several standard deviations of more transactions or…a higher dollar amount will trigger a fraud alert,” he said.
Rathle said those patterns are easy to detect since systems review aggregated data around transaction volumes and transaction sizes.
What is harder to detect is when people collude. He offered the example of paper accidents that occur in the car insurance industry.
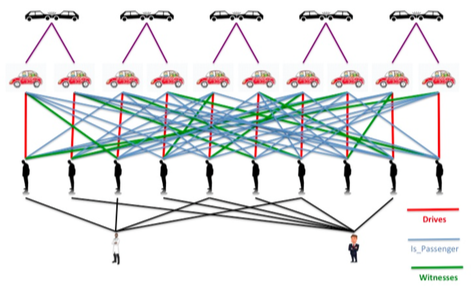
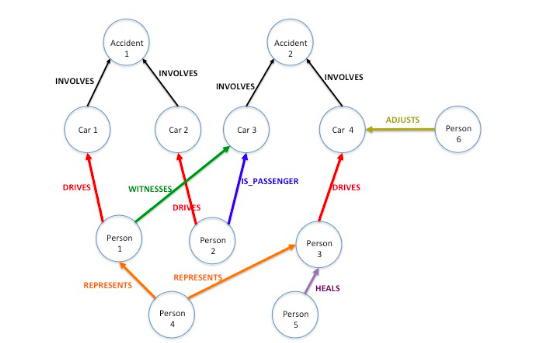
“Accidents that didn’t really happen that are the result of multiple people colluding and playing different roles. You might have one person who pretends to be the driver, another person who pretends to be a passenger, and then usually a doctor, sometimes an attorney in on this whole scam,” explained Rathle. “Oftentimes these people won’t just do one of these, they’ll do a number. They’ll have a number of paper accidents where different people play different roles. They try to trick the system that way. If you just look at any individual one of these incidents in isolation, it’s very hard to detect them.”
A graph analysis showing the way the data is connected, the people involved and the accidents, Rathle said, will show a pattern.
“You can start to see that if I have five different accidents in the last two years and the same person was the driver in two of them, and the passenger in one, and the doctor in a third then that starts to raise some suspicion,” said Rathle. “A lot of the more serious fraud that occurs in the insurance industry and across other industries as well involves collusion between individuals and criminal gangs or organizations that create multiple events, and depending on the scenario usually you can link these together by looking at the patterns that occur, following the connections and following the relationships.”
An insurer can use the graph technology database and build out from it. It can run alongside an existing predictive analytic system to augment existing rules to make them real time and preventative, rather than after the fact.
“What we’ll usually see is someone building an application around Neo4j bringing their data and using centered IT integration techniques from other systems” Rathle said.
A drawback is that companies can’t share information gleaned about connections with other insurers.
An estimated 60 percent of its customers are in the U.S., with the rest located in Europe.
The company sees opportunity in the property/casualty industry, Rathle said, who noted the company has saturated the global banking industry.
“From the insurance perspective, I’d say we are probably in half a dozen carriers or so,” Rathle said.
The system is valuable in any line of insurance, said Rathle, including auto, home and workers’ compensation.
The database cost is based on data and queries.
“It ties back to the amount of computing capacity, so the more data you have and the more things you are doing with it, that drives the need for more machines and bigger machines,” he explained.
A trend that the company is at the center of is moving from batch after the fact analysis into real time introduction transaction analysis.
“Often times you’ll catch fraud after it happens by doing this more complex analysis on data that’s already transacted. The disadvantage of the latter is I haven’t made a prediction,” said Rathle. “I’ve just uncovered something that’s happened and these people are really good at disappearing, especially if the identities were fictitious which sometimes is the case. The disadvantage of doing your predictive analytics in batch is that you’re not always able to respond to the very latest behaviors, which often times are the most interesting or significant.”
He offered the example of a credit card scam or first party bank fraud.
“You’ll have all these real credentials that are combined to create false identities, which…open all these accounts, charge them up, and then in the span of a few hours they’ll essentially liquidate…those accounts, max out the credit lines and then disappear,” Rathle explained.
One German insurance provider has built a master data management system behind an interface that’s now used by all of their exclusive agents, brokers and house call center, so that across multiple lines of business everyone is getting a unified view of the customer.
Rathle said firms measure savings as top line revenue because it is money the companies weren’t expecting to get.
Besides its use in fraud detection, Rathle said there is a lot of value in using it to understand and manage risk.
“Insurers are better than any other industries at understanding and managing risks. It’s actuarial science, but there’s a whole wide opportunity of understanding how certain events can cascade through a network,” Rathle said. “If you’re doing property or casualty or business insurance and you’re trying to insure against different scenarios, then understanding how physical goods flow through the supply chains, and how a company might be exposed through risks to its suppliers… all those areas are opportunities for insurers to differentiate themselves and to improve their businesses.”
Was this article valuable?
Here are more articles you may enjoy.
 LA County Told to Pause $4B in Abuse Payouts as DA Probes Fraud Claims
  Hackers Hit Sensitive Targets in 37 Nations in Spying Plot
  Tesla Sued Over Crash That Trapped, Killed Massachusetts Driver
  US Will Test Infant Formula to See If Botulism Is Wider Risk
Want to stay up to date?
Get the latest insurance news
sent straight to your inbox.