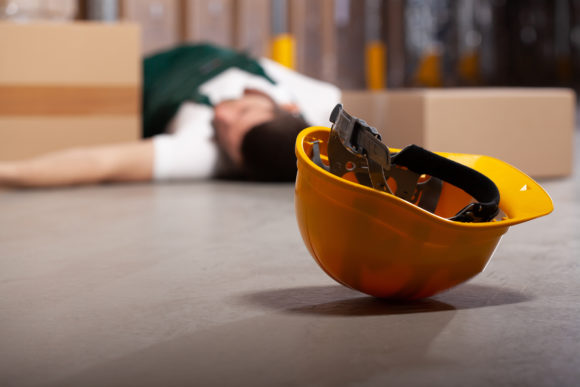
The workplace injury rate for private-sector workers has been dropping year after year for decades. But 2018 was not one of those years.
The U.S. Bureau of Labor Statistics reported last week that the incidence rate of nonfatal injuries and illnesses for private-sector workers remained at 2.8 for 100 full-time workers in 2018. That was unchanged from the prior year and the first time since 2012 that the workplace injury rate did not decrease, according to the bureau.
The lack of improvement comes after a long, steady decline in accident and illness rates. In 1994 — the first injury data available from the BLS’s online records — there were 6.8 million workplace injuries and illnesses in the private sector — an incidence rate of 8.4 per 100 workers. That declined to an incidence rate of 3.4 by 2011. After a small uptick in 2012, the incidence rate dropped in each year until 2018.
The retail sector was exceptionally accident-prone last year. The bureau said the rate of injuries and illnesses increased from 3.3 to 3.5 cases per 100 workers. The number of injuries and illnesses increased 4 percent to 409,900.
The bureau said it has not seen an increase in the incident rate for the retail sector since 2003 it started keeping detailed records in 2003. Retail was the only sector that saw an increase in the incident rate.
The bureau said there were 126,850 incidents involving days away from work in retail trade in 2018. Those resulting from falls, slips, or trips increased to 34,190 cases, an increase of 11 percent from 2017. Cases resulting from contact with objects and equipment increased 10 percent in 2018 to 38,940 cases.
Lost-time cases resulting from falls and contact with objects were higher in the retail sector than for private industry workers as a whole, according to the bureau.
AmTrust Financial issued a special report on workplace accidents in the retail sector last month. The carrier said when an injury involves lost time, the worker is out for an average of 24 days. Lost time varies by accident type. For strains, workers are lost an average of 33 days and for falls the average lost time was 30 days, the AmTrust report says. Claims caused by collapsing materials resulted in more lost time than any other injury type outlined by AmTrust, with an average time away from work of 129 days.
Other industries saw improvements in 2018. Agriculture, forestry, fishing and hunting sector saw its injury and illness rate increase from 5 to 5.3 per 100 workers. Manufacturing saw a decrease to 3.4 from 3.5. The construction industry saw its rate fall to 3 from 3.1.
The bureau compiles its reports from data reported by employers to the U.S. Occupational Safety and Health Administration. Its statistics don’t necessarily coincide with the number of workers’ compensation claims filed.
The National Council on Compensation Insurance reported in May that the estimated lost-time claim frequency for accident year 2018 was estimated to be 1% lower than the frequency in 2017. That was a more modest decline than in previous years. From 2016 to 2017, for example, claims frequency declined by 4.8%.
NCCI said that previous research has show a strong economy with new job growth puts upward pressure on claim frequency as employers are forced to hire less experienced staff. Also, a relatively severe 2018 winter may have contributed to an increased number of sips and falls, the organization said. Random volatility might also have played a role.
The long-term tend is clear: NCCI said from 1998 to 2019, the number of lost-time claims declined an average of 3.9% annually. Frequency increased in only one year during that timeframe; in 2010 it jumped more than 3%, according to the report.
Was this article valuable?
Here are more articles you may enjoy.
 New York, California Sizzle as Extreme Heat Strains Power Grids
  Citadel Securities Asks to Join Susquehanna Insider-Trading Suit
  Texas Floods, Canada Smoke and Western Heat Batter US
  New EVs From Toyota, Subaru Breathe Life into Struggling Market
Want to stay up to date?
Get the latest insurance news
sent straight to your inbox.