On Wednesday afternoon, the Hillsborough River at Morris Bridge Road north of Tampa, Florida, was flowing at more than 3,020 cubic feet per second. The surface of the river was at 31.48 feet above sea level and dropping after cresting just a few inches below flood stage.
Near Nashville, Tennessee, high winds blew down a 10-inch diameter tree in the Lockland Springs community. Across the border in Kentucky, storm clouds roiled toward the southeast. The National Weather Service warned of a slight risk of severe thunderstorms.
In northern Arizona, the Castle Fire was 0% contained after burning through 19,368 acres of woodlands in the Kaibab National Forest. Lightning ignited the blaze on July 12, according to the U.S. Forest Service. Firefighters were manning the perimeters, but allowing the fire to burn to clear out dead and downed trees.
Each potential disaster was marked on the several interactive online maps maintained by Esri, a geographical information service provider. Esri is now offering free public access to portions of its ArcGIS Living Atlas of the World, which is collection of maps that display both current and historical information on wildfires, earthquakes, flooding and severe weather.
Until July, Esri provided the data only as part of a subscription service, said Ryan Lanclos, director of public safety solutions for the Redlands, California-based technology company.
“Anybody and everybody can use this open source,” Lanclos said in an interview. “We’ve removed all log-in credentials.”

The wildfire map and other interactive maps display data that is reported live from a variety of sources, including the Forest Service, National Weather Service and the U.S. Geological Survey. All are part of Esri’s Disaster Response Program. Some of the information is inputted automatically as agencies update their databases.
The Disaster Response Program includes interactive maps displaying earthquake locations and intensity; observed flooding, warning areas and current precipitation; hurricane projected paths, storm surges and precipitation; and severe weather reports including tornadoes and hail storms.
Lanclos said Esri created the disaster program in response to the 1994 Northridge Earthquake in Los Angeles County. He said Esri’s mapping software gives emergency management agencies an interactive platform that greatly increases situational awareness. For example, after an earthquake, officials can map areas with the most severe damage and plan recovery efforts. They can even track the performance of contractors who are hired to remove debris.
“We allow people to do science-based statistical analysis geographically,” Lanclos explained. The imagery and data, he said, aids understanding to solve problems.
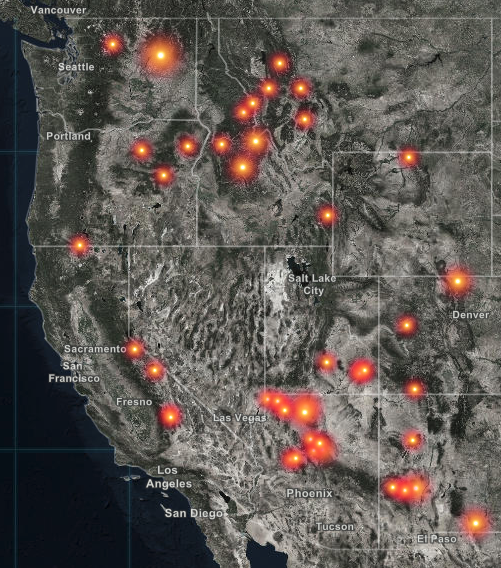
Professionals who make their living tracking disasters can use the living atlas to quickly gain situational awareness. On the wildfire map, wildfires currently burning are plotted with orange dots. The user can click on one of those icons to zoom in for more information, such as when the blaze started, how many acres were burned and the progress made by firefighters. The map includes a link to Google’s news page to search for media reports.
Similarly, the severe weather map plots wind direction and displays the location of reported high wind, hail storms and tornados. The flooding map plots water levels.
Lanclos said Esri didn’t start out as a disaster mapping provider. The company was originally founded in 1969 as “Environmental Systems Research Institute.” He said in the early days the company marketed its geographical information system software as an urban planning tool. The company also builds maps that track crime, allowing users to plot “hot spots” and “cool spots” that can reveal patterns and increase public officials’ understanding.
He said the increasing severity of natural disasters prompted Esri to offer free public access to its weather and disaster live feeds. “Those events are stronger, bigger and cover larger areas than ever before.”
“This new normal we live in tasks all of us to do our part,” Lanclos said.
About the photo: This screen shot, taken Wednesday afternoon, shows Esri’s wildfire information map.
Was this article valuable?
Here are more articles you may enjoy.
 Texas Floods, Canada Smoke and Western Heat Batter US
  Former Pro Soccer Players Show Brain Changes But No Cognitive Decline
  US Takes Aim at Autonomous Car Mishaps in Safety Rulemaking Push
  US Considers Creating Finra-Like Watchdog to Vet Top AI Models
Want to stay up to date?
Get the latest insurance news
sent straight to your inbox.