How long does it really take for your car to come to a complete stop? While the technical answer lies in the laws of physics – to do it safely, that’s a whole other ball game.
Progressive Insurance analyzed more than 12 billion miles of driving data from Snapshot, its usage-based insurance program, to release the first Lead Foot Report. The report looks at the average distance and time it takes for drivers going varying speeds to come to a complete stop safely, and the answer may come as a surprise.
For years, driving schools and textbooks have instructed new drivers to keep four seconds between you and the car in front of you. According to Progressive Snapshot data, you might want to leave even more room, so you have time to react if the car in front stops suddenly.
In looking at the most aggressive one percentile of stops, it takes drivers 12 seconds to come to a complete stop when traveling 60 MPH.
At the other extreme, the most gradual one percent of stops from 60 mph take a full 40 seconds.
The average driver falls right in the middle at 24 seconds – this equates to the distance of 4.2 football fields, or singing Happy Birthday three times in a row.
“After analyzing Snapshot driving data, we’ve found hard braking to be one of the most highly predictive variables for predicting future crashes,” said Dave Pratt, general manager of usage-based insurance for Progressive. “We know that one of the main contributors to hard braking is tailgating, so we’re using our data to help drivers be as alert and aware as possible on the road. We’ve gathered billions of miles of driving data and are only just beginning to scratch the surface in terms of the types of predictive behavior our Snapshot analytics can reveal.”
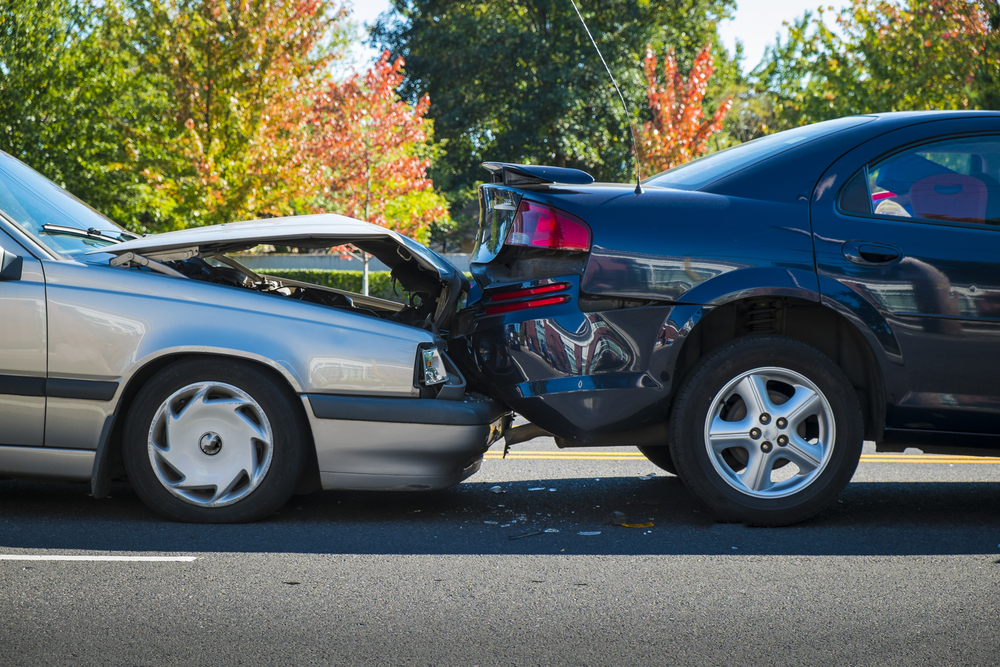
Progressive’s 2014 Year in Claims Report found that the top auto claim for the year was rear-ending, alerting drivers to think twice before following other cars too closely. When examining the most cautious drivers versus the riskiest, Progressive finds that the safest drivers allow an average of 39 percent more time and 32 percent more distance, respectively, to stop. Average time and distance to stop are as follows:
| Starting Speed | Distance to Stop | Time to Stop |
| 10 MPH | 86 feet | 8 seconds |
| 20 MPH | 207 feet | 11 seconds |
| 30 MPH | 372 feet | 14 seconds |
| 40 MPH | 581 feet | 17 seconds |
| 50 MPH | 851 feet | 20 seconds |
| 60 MPH | 1,262 feet | 24 seconds |
The Lead Foot Report also found some interesting comparisons in relation to gender, age and geographical location:
- When comparing men and women’s average braking habits, the safest male drivers have 77 percent less hard brakes than the most aggressive female drivers.
- While many assume that all teen drivers fall within the riskiest driver category, in actuality the safest quarter of 16 year-olds have fewer hard brakes than the average driver in every age decade.
- The report also examines median speeds by drivers in each state. Alabama and Mississippi drivers clock the highest median speed in a one-day period, coming in at 40 MPH, meaning half of all driving in these states is faster than 40 mph and half is slower. Meanwhile, the slowest median speed can be found in Washington, D.C. at 24 MPH.
Source: Progressive Insurance
Was this article valuable?
Here are more articles you may enjoy.
 Software Firm CCC Intelligent Solutions Exploring Sale: Reuters
  Allianz Unit to Cut as Many as 1,800 Jobs in Push to Adopt AI
  Scientists Affirm Climate Change Fuels Extreme Weather
  US Takes Aim at Autonomous Car Mishaps in Safety Rulemaking Push
Want to stay up to date?
Get the latest insurance news
sent straight to your inbox.