View this article online: https://www.claimsjournal.com/news/national/2016/12/01/275271.htm
In the famous comedy by William Shakespeare, “The Taming of the Shrew,” the main plot depicts the courtship of Petruchio and Katherina, the headstrong, uncooperative shrew. Initially, Katherina is an unwilling participant in the relationship, but Petruchio breaks down her resistance with various psychological torments, which make up the “taming” — until she finally becomes agreeable.
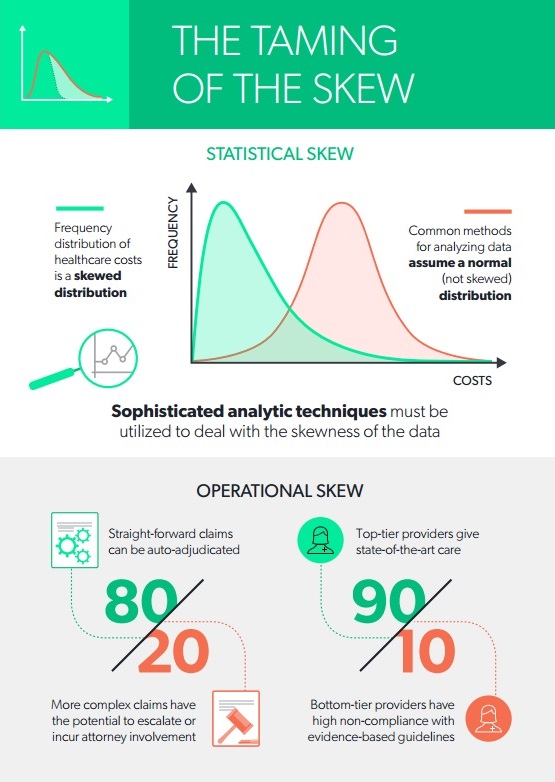
An analogous challenge exists when using predictive analytics with healthcare data. Healthcare data can often seem quite stubborn, like Katherina. One of the main features of healthcare data that needs to be “tamed” is the “skew” of the data. In this article, we describe two types of skewness: the statistical skew, which impacts data analysis, and the operational skew, which impacts operational processes.
Because the distribution of healthcare costs is bounded on the lower end — that is, the cost of healthcare services is never less than zero but ranges widely on the upper end, sometimes into the millions of dollars — the frequency distribution of costs is a skewed distribution. More specifically, in the following plot of frequency by cost, the distribution of healthcare costs is right-skewed because the long tail is on the right (and the coefficient of skewness is positive):
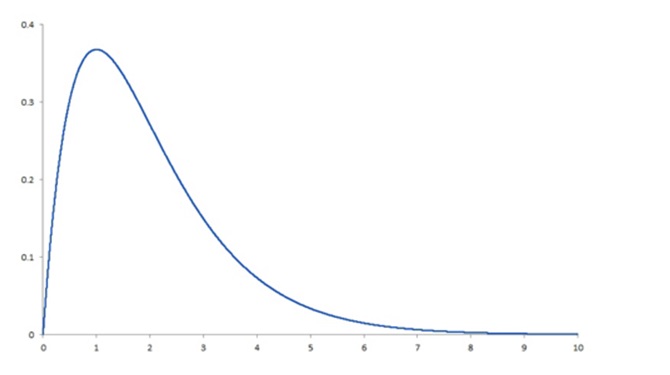 This skewness is present whether we are looking at total claim expense in the workers’ compensation sector or annual expenses in the group health sector. Why is this a problem? Simply because the most common methods for analyzing data depend on the ability to assume that there is a normal distribution, and a right-skewed distribution is clearly not normal. It fails to conform to the assumption of normality. To produce reliable and accurate predictions and generalizable results from analyses of healthcare costs, the data need to be “tamed” (i.e., various sophisticated analytic techniques must be utilized to deal with the right-skewness of the data). Among these techniques are logarithmic transformation of the dependent variable, random forest regression, machine learning, topical analysis and others.
It’s essential to keep this in mind in any analytic effort with healthcare data, especially in workers’ compensation. To get the required level of accuracy, we need to think “non-normal” and get comfortable with the “skewed” behavior of the data.
There is an equally pervasive operational skew in workers’ compensation that calls out for a radical change in business models. The operational skew is exemplified by:
How can we deal with operational skew? The first step is to be aware of it and be prepared to use different tactics depending on which end of the skew you’re dealing with. In the two examples just given, we have observed that by using the proper statistical approaches:
Both of these examples show that what used to be a single business process —managing every claim by the high-touch, “throw a nurse or a doctor at every claim” approach, as noble as that sounds — now requires the discipline to enact two entirely different business models in order to be operationally successful. Let me explain.
The difference between low- and high-risk claims is not a subtle distinction. Low-risk claims should receive a minimum amount of intervention, just enough oversight to ensure that they are going well and staying within expected parameters. Good technology can help provide this oversight. Added expense, such as nurse case management, is generally unnecessary. Conversely, high-risk claims might need nurse and/or physician involvement, weekly or even daily updates, multiple points of contact and a keen eye for opportunities to do a better job navigating this difficult journey with the recovering worker.
The same is true for managing your network. It would be nice if all providers could be treated alike, but in fact, a small percentage of providers drives the bulk of the opioid prescribing, attorney involvement, liens and independent medial review (IMR) requests. These “bad apples” are difficult to reform and are best avoided, using a sophisticated provider scoring system that focuses on multiple aspects of provider performance and outcomes.
Once you have tamed your statistical skew with the appropriate data science techniques and your operational skew with a new business model, you will be well on your way to developing actionable insights from your predictive modeling. With assistance from the appropriate technology and operational routines, the most uncooperative skewness generally can be tamed. Are you ready to “tame the skew”?
 Read Dr. Gardner’s first two articles in this series:
Five Best Practices to Ensure the Injured Workers Comes First
 Dr. Laura Gardner is an expert in analyzing U.S. health and workers’ compensation data. Visit http://www.claraanalytics.com/ and follow CLARA Analytics on LinkedIn, Facebook and Twitter.