A decade after Hurricane Katrina caused $41 billion in property and casualty insurance losses, the most expensive catastrophe ever experienced by the global insurance industry, rising sea levels are driving up expected economic and insurance losses from hurricane-driven storm surge in coastal cities across the United States, according to new analysis by RMS, a global catastrophe risk management firm.
RMS assessed risk in six U.S. coastal cities to determine how losses from storm surge, defined as wind-driven coastal flooding, are expected to change through 2100.
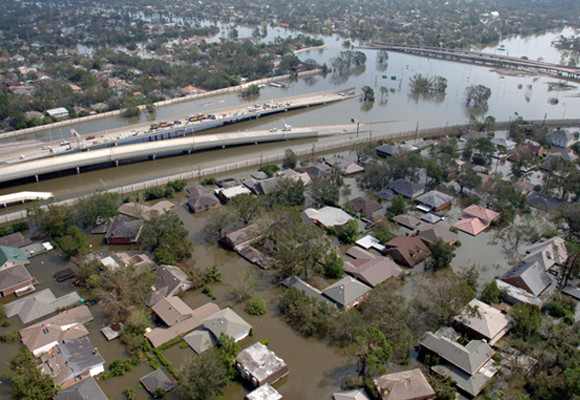
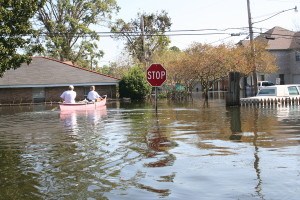
Risk in New Orleans
By 2100, the sea-level rise near New Orleans is expected to be greater than 1.3 meters (4.3 feet), increasing the chance of catastrophic citywide flooding by more than four times unless further improvements are made to raise flood defences by an equivalent height.
 “Looking forward, New Orleans is faced with a double-whammy. The land on which the city is built is sinking, even faster than the sea levels are rising,” said Dr. Robert Muir-Wood, chief research officer at RMS. “As a result, the rise in flood heights is much faster than at any other city along the U.S. coast.”
However, RMS analysis shows that, due to significant investments in improved flood defences and reduced exposures, the annual chance of a storm surge today causing at least $15 billion in economic loss – the amount caused by Hurricane Katrina in 2005 – is currently much lower in Orleans Parish than for cities such as Miami, New York and Tampa.
Coastal Flood Risk Around the U.S.
The study shows that currently, Tampa faces the highest risk among the six cities included in the study, with a 1-in-80 annual chance of experiencing a $15 billion storm surge loss. Miami faces a 1-in-125 chance, New York a 1-in-200 chance and New Orleans a 1-in-440 chance.
RMS models show those likelihoods are expected to increase greatly over time – by up to 350 percent in some cities by 2100. The chance of a storm surge event causing at least $15 billion in economic losses, using today’s dollar values and exposures, in 2100 rises to 1-in-30 in Tampa, 1-in-30 in Miami, 1-in-45 in New York and 1-in-315 in New Orleans.*
| Current | 2030 | 2070 | 2100 | |
| Baltimore | Slimmer than 1-in-1 million | |||
| Boston | Slimmer than 1-in-1 million | |||
| Miami | 1-in-125 | 1-in-90 | 1-in-45 | 1-in-30 |
| New Orleans* | 1-in-440 | 1-in-380 | 1-in-345 | 1-in-315 |
| New York | 1-in-200 | 1-in-130 | 1-in-75 | 1-in-45 |
| Tampa | 1-in-80 | 1-in-65 | 1-in-45 | 1-in-30 |
Chance that an event will cause at least $15 billion in economic losses from storm surge in a given year, according to RMS modeling. All dollar amounts are in 2015 dollars.
*Figures for New Orleans are calculated on the assumption that flood defences are raised in step with water levels.
Increased Risk from Storm Surge
Another way to demonstrate storm surge risk over time is to look at changing economic losses at the 100-year return period – the standard metric used by the global insurance industry to calculate the cost of risk.
According to RMS models, economic storm surge losses at the 100-year return period in New York are $9 billion today – meaning there is a one percent chance of at least that amount of losses occurring in a given year. By 2100, the figure more than doubles to $23 billion. For comparison, Superstorm Sandy in 2012 caused just over $15 billion in losses from storm surge in the city of New York.
Similarly large increases in 100-year return period surge losses were found for Tampa and Miami. There is a one percent chance that Tampa will experience at least $17 billion in economic storm surge losses this year. In 2100, that number rises to $25 billion. Miami’s 100-year surge losses rise from $13 billion today to $33 billion in 2100.
| Current | 2030 | 2070 | 2100 | |
| Baltimore | $126 million | $214 million | $360 million | $487 million |
| Boston | $476 million | $748 million | $1.1 billion | $1.5 billion |
| Miami | $13 billion | $17 billion | $25 billion | $33 billion |
| New Orleans | $411 million | $414 million | $625 million | $836 million |
| New York | $9 billion | $13 billion | $18 billion | $23 billion |
| Tampa | $17 billion | $19 billion | $22 billion | $25 billion |
100-year return period storm surge losses – the economic loss that has a one percent chance of being exceeded in any given year – according to RMS modeling. All dollar amounts are in 2015 dollars.
“Hurricane Katrina was the first time in decades that more than 50 percent of losses from a hurricane resulted from storm surge,” said Muir-Wood. “Katrina can be seen as a milestone in the long-term shift from ‘wind’ to ‘water’ as the main driver of hurricane loss. In 2012, Superstorm Sandy had more than 60 percent of its losses caused by storm surge flooding.”
Due to sea-level rise, by 2100 storm surge is expected to generate more than half of the economic losses that result from hurricane in the U.S. across hurricane-exposed states.
“This analysis does not take into account the potential further impact of changes in hurricane frequency and severity that may also occur over this time, but for which there is as yet no scientific consensus,” said Muir-Wood.
Source: RIMS
Was this article valuable?
Here are more articles you may enjoy.
 Hackers Hit Sensitive Targets in 37 Nations in Spying Plot
  Navigators Can’t Parse ‘Additional Insured’ Policy Wording in Georgia Explosion Case
  UBS Top Executives to Appear at Senate Hearing on Credit Suisse Nazi Accounts
  US Will Test Infant Formula to See If Botulism Is Wider Risk
Want to stay up to date?
Get the latest insurance news
sent straight to your inbox.