According to the latest Bureau of Labor Statistics’ Census of 2016 Fatal Occupational Injuries report, there were 5,190 workplace fatalities in 2016, a 7-percent increase from 2015. The fatal injury rate also increased from 3.4 per 100,000 full-time equivalent workers in 2015 to 3.6 in 2016.
More workers lost their lives in transportation incidents than any other event in 2016, accounting for about two out of every five fatal injuries. Workplace violence injuries increased by 23 percent, making it the second most common cause of workplace fatality.
Fatalities due to falls, slips and trips continued to rise, according to the report, increasing 6 percent in 2016 and rising 25 percent since 2011. Falls increased more than 25 percent in 2016 for roofers, carpenters, tree trimmers and pruners, and heavy and tractor-trailer truck drivers.
The number of overdoses on the job increased by 32 percent in 2016, and the number of fatalities has increased by at least 25 percent annually since 2012.
“Today’s occupational fatality data show a tragic trend with the third consecutive increase in worker fatalities in 2016 – the highest since 2008,” said Loren Sweatt, deputy assistant secretary for OSHA, in a statement following the release of the report.
She explained that OSHA will work to address these trends through enforcement, compliance assistance, education and training, and outreach.
Additional findings include:
- A number of occupations recorded their highest fatality counts in 2016 since CFOI adopted the Standard Occupational Classification (SOC) system in 2003. This includes first-line supervisors of construction trades and extraction workers with 134 fatal injuries; landscaping and groundskeeping workers, 125; roofers, 101; tree trimmers and pruners, 84; driver/sales workers, 71; automotive service technicians and mechanics, 64; and farmworkers, farm, ranch, and aquacultural animals, 61.
- Asian, non-Hispanic workers incurred 160 fatal injuries, up from 114 in 2015, which was the highest percentage increase (40 percent) among any race or ethnic origin. Black or African-American, non-Hispanic workers also had a large percentage increase (19 percent), with 587 fatal injuries compared to 495 in 2015.
- The rate of fatal injury for both groups also increased. Hispanic or Latino workers had 3 percent fewer workplace fatalities in 2016 with 879 fatalities, down from 903.
- Foreign-born workers make up about one-fifth of the total fatal work injuries. Thirty-seven percent of these workers were born in Mexico, followed by 19 percent from Asian countries.
- Workers age 55 years and over had 1,848 fatal injuries, the highest number for this cohort since CFOI began reporting national data in 1992. In 1992, workers age 55 and over accounted for 20 percent of fatalities; in 2016, they accounted for 36 percent. These workers also have a higher fatality rate than other age groups.
- The number of workplace fatalities in private industry increased 7 percent
in 2016. This was led by an increase in service-providing industries, which were up 13 percent to 2,702 from 2,399. Fatal workplace injuries to government workers increased 9 percent overall to 497, with a 9-percent decrease in federal
employee fatalities that was more than offset by increases in state and local government fatalities, up 20 percent and 13 percent, respectively.
- Fatal injuries in the leisure and hospitality sector were up 32 percent (225 to 298) and reached an all-time series high in 2016. This was largely due to a 40-percent
increase in fatal injuries in the food services and drinking places industry from 118 to 165.
Source: BLS
Was this article valuable?
Here are more articles you may enjoy.
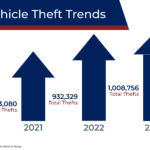 National Crime Report Shows Vehicle Thefts Surged to More than 1 Million in 2023
  US Eyeing Ship’s Electrical System After Baltimore Bridge Crash
  Johnson Controls Unit to Pay $750M to Settle ‘Forever Chemicals’ Lawsuit
  Property Restoration Industry: A Culture in Need of Repair?
Want to stay up to date?
Get the latest insurance news
sent straight to your inbox.