View this article online: https://www.claimsjournal.com/blogs/ccc-information-services/2016/06/01/271047.htm
This post is part of a series sponsored by CCC Information Services.
Numerous studies have been completed over the years that show consumer satisfaction with auto insurance companies is tied to their satisfaction with the vehicle repair. Consumers say they want more visibility throughout the claim and repair process, and prefer information be sent to them on the device and at the time of their choosing. In fact, results of a recent analysis of CCC ONE® Update Plus CSI survey details discussed during in our December 2015 CCC Trends video found the quality of the repair, customer service and managing customer expectations by keeping them informed throughout the repair are what customers value the most.
And while the actual cycle time was found to be less important to a customer’s overall satisfaction, cycle time is still important to both the carrier and the collision repairer, particularly in those cases where a rental vehicle is being used, and rental costs are adding to the overall cost of the claim.
As a result, more repairers and insurers are taking a more active role in managing both cycle time and claim satisfaction, using mobile and digital technology to enable greater consistency and better automation in communication about the repair between all parties.
Historically, repairers and insurers have used length of rental as a key indicator of repair cycle time. This was largely due to the inability to share information on repair events consistently and in a manner that did not require repairers to jump in and out of multiple systems. Today shops can provide repair status events not only with the insurer, but also with the customer through CCC ONE® Update Plus Status, resulting in better visibility of the vehicle repair process. In fact, in many cases, the events entered into CCC ONE automatically update data in rental providers’ systems.
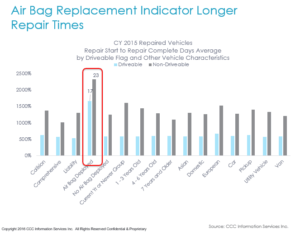
And, data from several analyses completed to understand the correlation of the length of rental metric to other repair cycle times suggests there is a very strong linear correlation between Rental Days and both “Vehicle In to Vehicle Out Days” and “Repair Start to Repair Complete Days”. Using repair cycle time metrics such as “Vehicle In to Vehicle out Days” also provides visibility into the cycle time on all repairs completed by a shop, not just those with a rental vehicle.
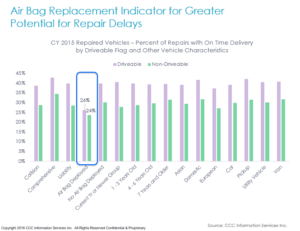
Adding in capability to segment repair cycle time by other key attributes of a vehicle repair such as whether the vehicle was driveable or non-driveable, whether an air bag deployed, and information re: the age and manufacturer source can help provide much needed clarity why a repairer’s cycle time may be trending one way or another.
For example, analysis of CCC national industry repair cycle time data for CY 2015 reveals some interesting observations:
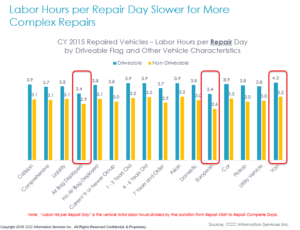
Standalone, one might intuit that an increase in average length of rental was trending up due to more heavily damaged vehicles, or a change in the mix of vehicles being repaired. Because not all claims include rental coverage, using metrics tracking the actual days from vehicle in to repair start, repair start to complete, and repair complete to vehicle out for all repairs can underscore whether a repairer can improve the vehicle scheduling process, or improve their communication with customers, giving them better visibility into when the vehicle will be ready for pickup, avoiding surprises that might lead to unplanned rental days.
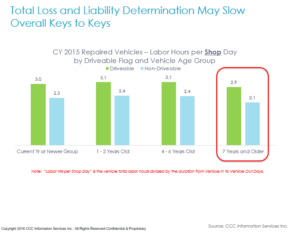
Segmenting these data points further by vehicle characteristics such as those illustrated above can also help a shop identify why its repair and keys-to-keys cycle might be trending a certain way. And finally, measuring cycle time all the way from the date the loss was reported through the date the vehicle is picked up by the consumer can help highlight inefficiencies between the various parties working that claim/repair.
Having the ability to manage the time spent during each portion of the claim and repair helps identify areas where improvements to processes exist. Proactive management of overall cycle time can improve shop productivity both in terms of labor hours per repair day but also labor hours per shop day. Information on the ‘actual’ and ‘planned’ dates for key events such as vehicle in, repair start, repair complete, vehicle out, and promise date support more active management of any differences them. Repairers can learn to shave time off of the claim and repair process and streamline communication between all parties by analysis of those claims where the planned and actual dates have wide variability. For example, by scheduling customers in when collision repair facility staff is available to begin repairs immediately, and communicating regular updates to the customer during the repair so vehicle pick-up can be arranged as close to repairs complete as possible will not only help reduce the overall repair cycle time but also lead to better customer satisfaction. Additionally, the ability to provide customers with dates that don’t change a great deal throughout the process can also lead to better customer satisfaction.
The information and opinions in this publication are for general information only, are subject to change and are not intended to provide specific recommendations for any individual or entity. Although information contained herein has been obtained from sources believed to be reliable, CCC does not guarantee its accuracy and it may be incomplete or condensed. CCC is not liable for any typographical errors, incorrect data and/or any actions taken in reliance on the information and opinions contained in this publication. Note: Where CCC Information Services Inc. is cited as source, the data provided is an aggregation of industry data related to electronic appraisals communicated via CCC’s electronic network or from total loss valuations processed by CCC.
![]()